Meet T3 - Tychobra Time Tracker
Peter Myers and Andy Merlino
2019/09/04
Raison d’être
At Tychobra, like many consulting businesses, we have multiple projects for multiple clients being worked on by multiple developers. To keep everything tracked to double precision, and because we love the taste of dog food, we built our own time tracking system using Shiny and our R package for authentication, Polished.
How it works
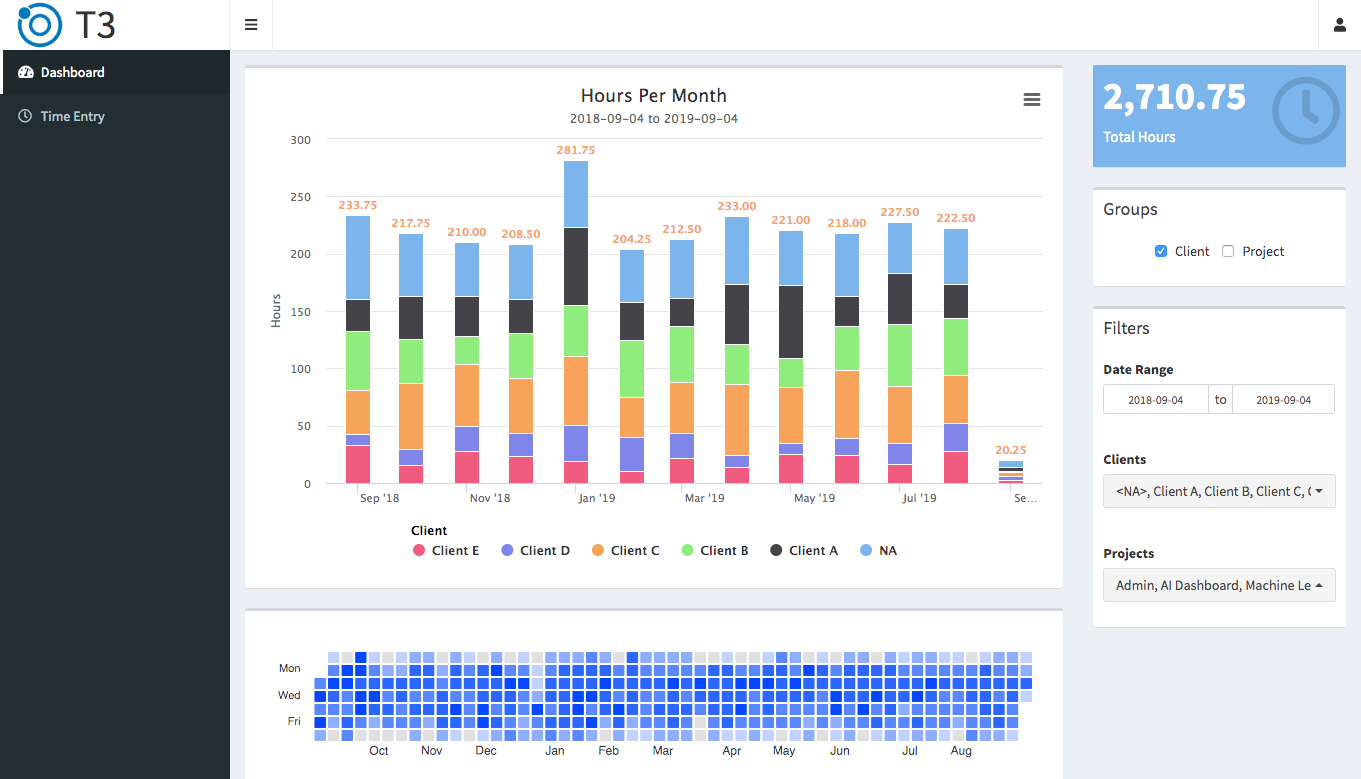
Dashboard
The dashboard presents several views of the data, most prominently a bar chart that can be broken down by client or by project. Below the chart, a heat map similar to what you’d see on GitHub gives an at-a-glance overview of hours worked per day. If you’re more of an Arabic numeral fan, a tabular display below the heat map contains the same information as the bar chart. Each of these outputs can be filtered to a date range, client, and/or project using the inputs on the right side.
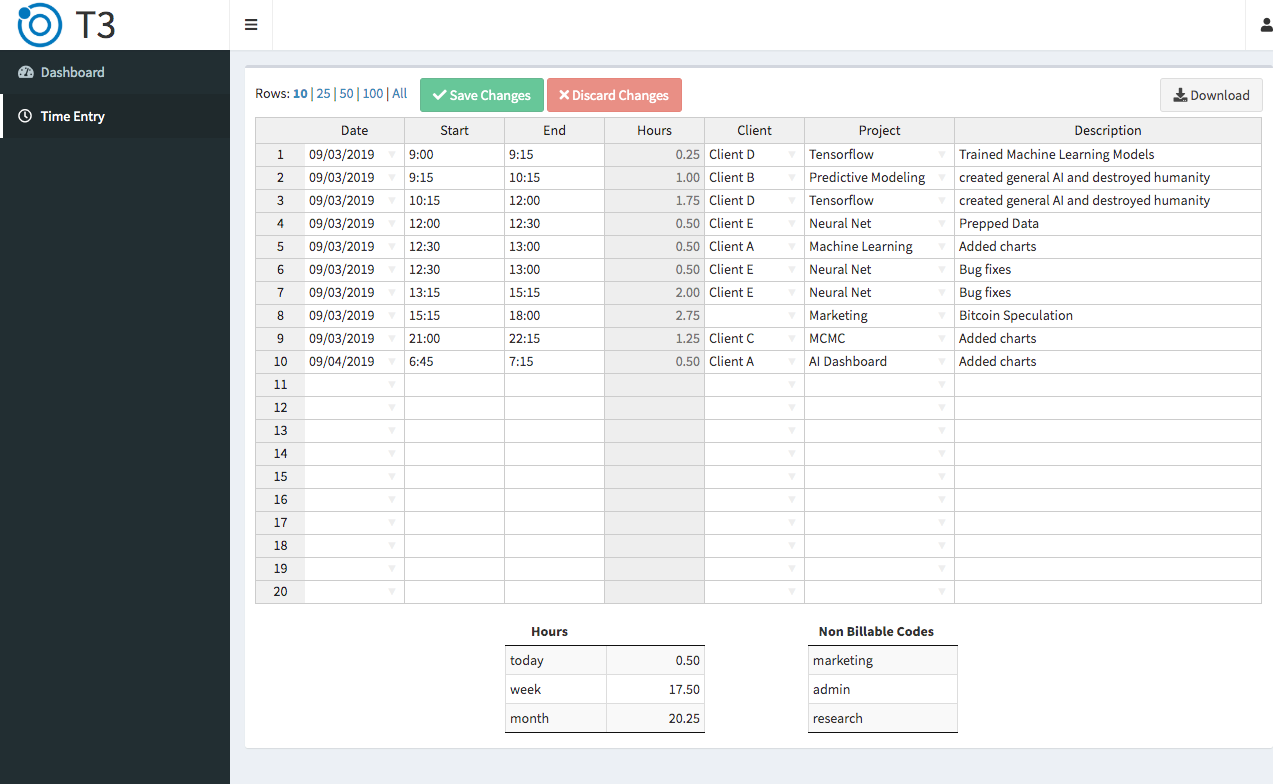
Time Entry
The left sidebar contains a link to the time entry tab. With a familiar spreadsheet interface, each row represents a record of billable time with a minimum of 15 minutes and a maximum depending on how much coffee is still available in the office. Client and project codes are tab-completable, populated from the internal database. As you’d expect, “Save Changes” persists the data and automatically updates the dashboard. “Discard Changes” wipes away any incorrect data entry, as can happen when your attention-demanding cat “helps” you type.
Try it yourself!
We’ve open sourced this project, with the code on GitHub and a live test instance for you to put in some hours. Sadly, we can’t cut you a check until you come work with us at Tychobra!
comments powered by Disqus